Latest
Election

Election 2026: The Fight for Congress and Every State’s Governor Race

A 50-state guide to the governor contests, the balance of power in Congress, and the latest available polls and forecasts.

Read the story
Election · Read the story
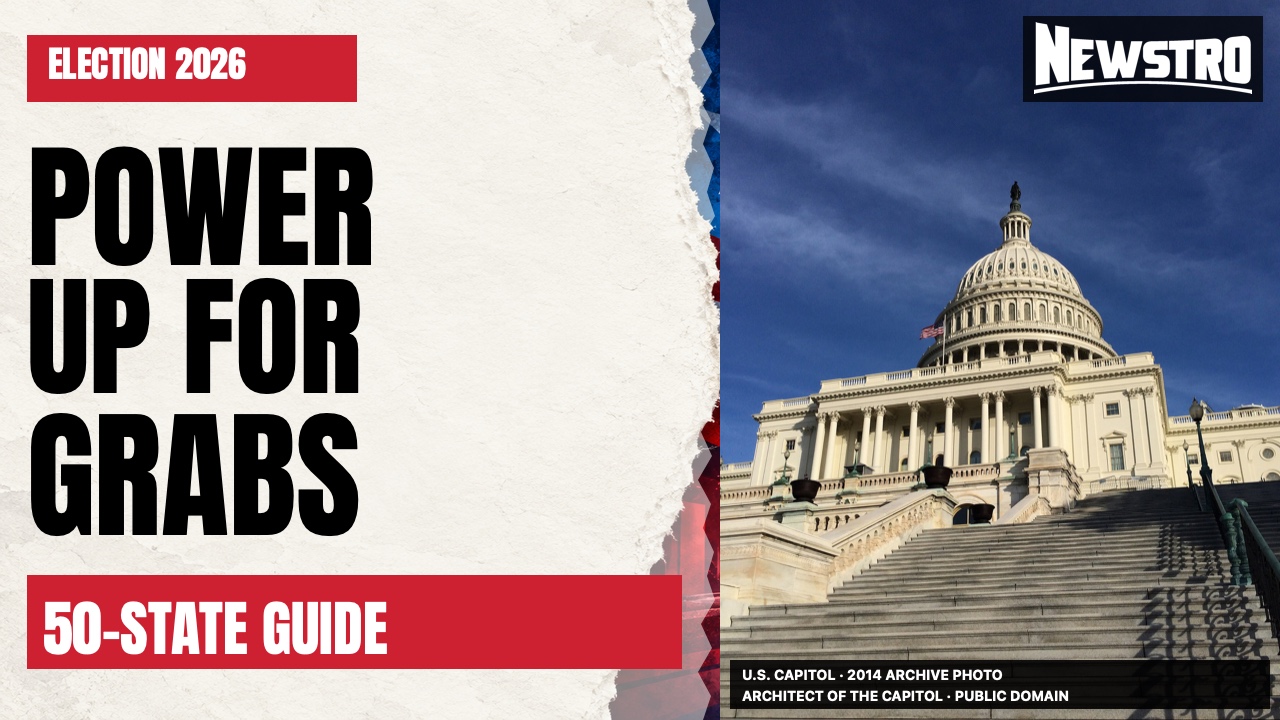
Election 2026 headline beside a 2014 archive photograph of the U.S. Capitol.
2014 archive photo: Architect of the Capitol / Wikimedia Commons · public domain
Share this story

Three contests for power, one election day

Data checked November 1, 2026, 1:31 AM Central. Forecasts and polls below are dated snapshots, not results.

Americans vote Tuesday, November 3, in an election that will decide control of both chambers of Congress and choose governors in 36 states. The national picture looks favorable to Democrats in the House. The Senate is closer, with the path to a majority running through races stretching from Alaska to Maine.

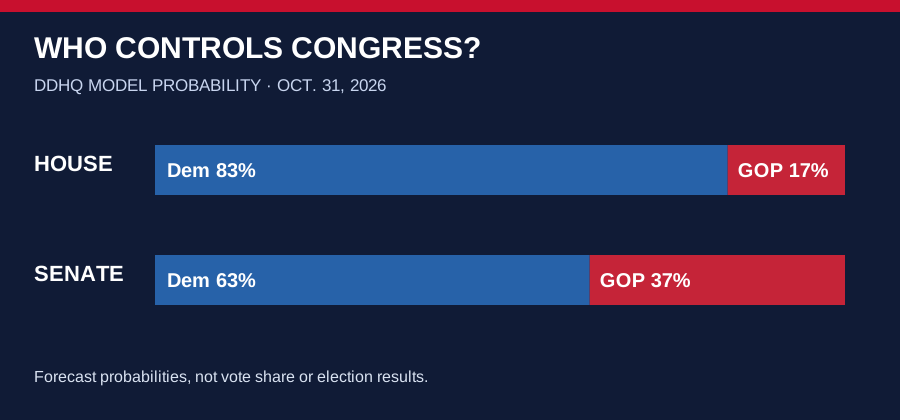
One well-known model, Decision Desk HQ’s October 31 forecast, gives Democrats an 83% chance to win the House and a 63% chance to control the Senate. That leaves real chances of a different outcome—particularly in the Senate. A model is an estimate, not a vote count, and other forecasts make different assumptions.

At stake are all 435 voting House seats, 35 Senate seats and 36 state governorships. The other 14 states have no regularly scheduled governor’s election this year. Three territories also elect governors; the state-by-state guide below covers the 50 states. Ballotpedia

Decision Desk HQ’s October 31 model gave Democrats an 83 percent chance of House control and a 63 percent chance of Senate control; Republican chances were 17 percent and 37 percent, respectively.
Forecast probabilities, not vote shares or results. Source: Decision Desk HQ, October 31 snapshot. The model incorporates polling and other factors.

The House: 218 is the number

A party needs 218 seats for a majority in a full House. Because every voting seat is on the ballot, national mood matters—but the majority is assembled one district at a time. A close national vote can yield a very different seat count depending on how voters are distributed and where district lines are drawn.

DDHQ’s October 31 model projected 241 Democratic seats and gave Republicans a 17% chance of holding the chamber. Among the races it identified as closest were Florida’s 22nd, Texas’ 15th and 35th, and Iowa’s 2nd. Those are model ratings, not declared winners. DDHQ forecast

The national “generic ballot” asks people which party’s congressional candidate they would support, rather than naming the candidates in all 435 districts. RealClearPolling’s average of surveys conducted from October 8–29 showed Democrats at 51.5% and Republicans at 43.1%, an 8.4-point Democratic edge in that aggregation. Averages depend on which polls are included; they are not actual votes.

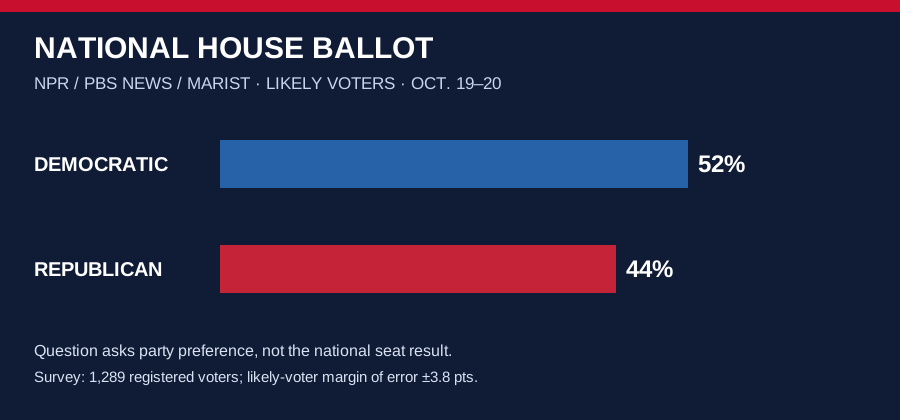
For a single survey with published methodology, an NPR/PBS News/Marist poll conducted October 19–20 found likely voters preferred Democratic House candidates 52% to 44%. Its national survey included 1,289 registered voters; the reported likely-voter margin of error was ±3.8 percentage points. That margin is for an individual estimate, not a guarantee about the difference between candidates.

NPR PBS News Marist survey of likely voters found Democratic House candidates at 52 percent and Republicans at 44 percent, October 19 to 20, 2026.
One national poll, not a seat forecast. Source: NPR/PBS News/Marist; fieldwork October 19–20; likely-voter margin of error ±3.8 points.

The Senate: four net seats change the majority

Republicans hold 53 Senate seats. Democrats hold 45, and two independents caucus with Democrats, giving that caucus 47. A net gain of three would create a 50–50 chamber; Republican Vice President JD Vance can break ties. A net gain of four would give the Democratic caucus 51 seats. If Democrats lose a seat they currently hold, they must offset that loss elsewhere. U.S. Senate · Associated Press

Of the 35 contests, 33 are regular elections and two are special elections. DDHQ’s October 31 snapshot put Kansas, Iowa, Ohio, Texas and Alaska in its toss-up category. Maine leaned Democratic and South Carolina leaned Republican in that model; Michigan leaned Democratic. Other models can—and do—disagree about individual races.

In Texas, Democrat James Talarico is running against Republican Ken Paxton for the open seat. A CNN/SSRS survey of 923 likely voters, conducted October 20–27, found Talarico at 49% and Paxton at 43%, with a reported ±4.2-point margin of error. That is one poll, not a guarantee of the outcome. RealClearPolling poll table

In Kansas, Republican Sen. Roger Marshall faces Democrat Adam Hamilton. Iowa’s open race pits Republican Ashley Hinson against Democrat Josh Turek. In Ohio’s special election, Republican Sen. Jon Husted faces Democrat Sherrod Brown. In Alaska, Republican Sen. Dan Sullivan faces Democrat Mary Peltola and two other finalists, including another candidate named Dan Sullivan; ballot confusion is the subject of litigation. The Alaska Democratic Party and Peltola campaign have denied involvement in recruiting the second Sullivan. KCUR · AP on Iowa · AP on Alaska

Georgia’s Democratic Sen. Jon Ossoff is defending a seat; Michigan’s open Democratic-held seat is another potential path for Republicans, where Democrat Abdul El-Sayed faces Republican Mike Rogers. In Maine, Republican Sen. Susan Collins faces Democrat Troy Jackson, who replaced the original nominee after the primary. Associated Press.

What recent polls say—and what they don’t

These are selected surveys, not a uniform national poll. Each has different field dates, sample sizes and methods. The figures show support for the named candidates, not the chance of winning. Undecided voters and other candidates are omitted unless noted. A small lead can be within a poll’s uncertainty, and polling errors can move several races in the same direction.

Nevada governor: Aaron Ford (D) 47%, Joe Lombardo (R) 47%.Noble Predictive Insights, October 26–28; 487 likely voters; ±4.44 points. A further 1% supported independent Danielle Ford and 4% were undecided.
Ohio governor: Amy Acton (D) 48%, Vivek Ramaswamy (R) 44%.Suffolk University/USA TODAY Network Ohio, October 21–26; 500 likely voters; ±4.4 points.
Texas Senate: James Talarico (D) 49%, Ken Paxton (R) 43%.CNN/SSRS, via RealClearPolling, October 20–27; 923 likely voters; ±4.2 points.
Texas governor: Greg Abbott (R) 48%, Gina Hinojosa (D) 46%.CNN/SSRS, October 20–27; 923 likely voters, as cataloged by Vote-Scope.
Rhode Island governor: Helena Foulkes (D) 44%, Ken Block (I) 35%, Aaron Guckian (R) 10%.Emerson College/WPRI-TV, October 8–11; 800 likely voters; ±3.5 points. Nine percent were undecided. This older survey shows why a two-party label cannot describe every contest.

The most recent publicly available survey is not equally recent in every state. Some races have few polls, and a forecast may lean on fundamentals and other inputs when there is little polling. For additional individual surveys, see Vote-Scope’s governor poll listings and RealClearPolling’s latest governor polls.

Governors: the 50-state guide

Governors can sign or veto legislation, shape state budgets and appoint officials. The 36 offices on the ballot are split 18–18 between Democratic and Republican incumbents, according to ElectioMap’s election guide. The table lists major-party nominees, the four Alaska finalists and selected notable independents; it is not a complete ballot. Incumbents are marked.

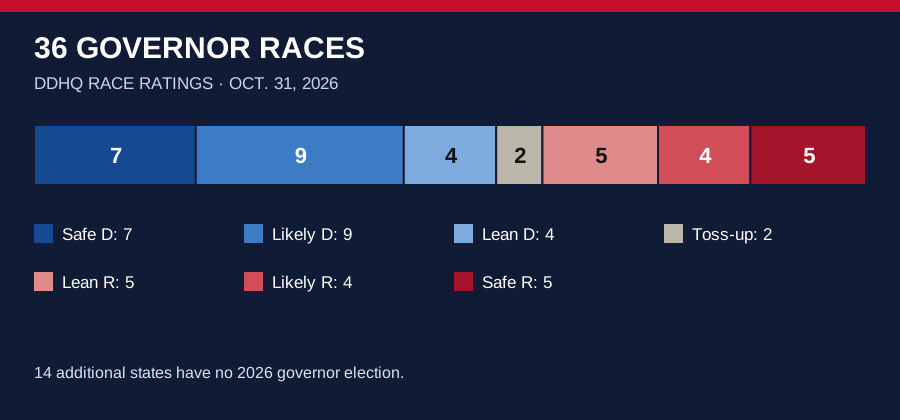
The ratings are Decision Desk HQ’s October 31 governor forecast, a model that uses more than polls. “Toss-up” means a particularly competitive race, not a tie in every survey. Ratings may change. “No 2026 race” means no state governor contest this November—not that voters lack other elections.

Of 36 governor races, Decision Desk HQ rated 7 safe Democratic, 9 likely Democratic, 4 lean Democratic, 2 toss-up, 5 lean Republican, 4 likely Republican, and 5 safe Republican; 14 states have no governor race.
Race-rating snapshot: Decision Desk HQ, October 31. These categories are forecasts, not winners or vote shares.

50 states shown.

All 50 states: governor candidates and DDHQ forecast rating
StateMajor candidates and selected independentsDDHQ rating
AlabamaDoug Jones (D); Tommy Tuberville (R)Likely R
AlaskaJonathan Kreiss-Tomkins (D); Dave Bronson (R); Treg Taylor (R); Bernadette Wilson (R)Lean D
ArizonaKatie Hobbs (D, incumbent); Andy Biggs (R)Likely D
ArkansasFred Love (D); Sarah Huckabee Sanders (R, incumbent)Safe R
CaliforniaXavier Becerra (D); Steve Hilton (R)Safe D
ColoradoPhil Weiser (D); Victor Marx (R)Likely D
ConnecticutNed Lamont (D, incumbent); Ryan Fazio (R)Likely D
DelawareNo governor election this NovemberNo race
FloridaDavid Jolly (D); Byron Donalds (R)Lean R
GeorgiaKeisha Lance Bottoms (D); Rick Jackson (R)Lean D
HawaiiJosh Green (D, incumbent); Gary Cordery (R)Safe D
IdahoTerri Pickens (D); Brad Little (R, incumbent)Safe R
IllinoisJB Pritzker (D, incumbent); Darren Bailey (R)Safe D
IndianaNo governor election this NovemberNo race
IowaRob Sand (D); Zach Lahn (R)Lean D
KansasCindy Holscher (D); Ty Masterson (R)Lean R
KentuckyNo governor election this NovemberNo race
LouisianaNo governor election this NovemberNo race
MaineHannah Pingree (D); Bobby Charles (R); Rick Bennett (I)Likely D
MarylandWes Moore (D, incumbent); Dan Cox (R)Safe D
MassachusettsMaura Healey (D, incumbent); Mike Minogue (R)Safe D
MichiganJocelyn Benson (D); John James (R)Likely D
MinnesotaAmy Klobuchar (D); Lisa Demuth (R)Likely D
MississippiNo governor election this NovemberNo race
MissouriNo governor election this NovemberNo race
MontanaNo governor election this NovemberNo race
NebraskaLynne Walz (D); Jim Pillen (R, incumbent)Likely R
NevadaAaron Ford (D); Joe Lombardo (R, incumbent)Toss-up
New HampshireCinde Warmington (D); Kelly Ayotte (R, incumbent)Lean R
New JerseyNo governor election this NovemberNo race
New MexicoDeb Haaland (D); Gregg Hull (R)Likely D
New YorkKathy Hochul (D, incumbent); Bruce Blakeman (R)Likely D
North CarolinaNo governor election this NovemberNo race
North DakotaNo governor election this NovemberNo race
OhioAmy Acton (D); Vivek Ramaswamy (R)Toss-up
OklahomaCyndi Munson (D); Mike Mazzei (R)Safe R
OregonTina Kotek (D, incumbent); Christine Drazan (R)Likely D
PennsylvaniaJosh Shapiro (D, incumbent); Stacy Garrity (R)Safe D
Rhode IslandHelena Foulkes (D); Aaron Guckian (R); Ken Block (I)Safe D
South CarolinaJermaine Johnson (D); Alan Wilson (R)Lean R
South DakotaDan Ahlers (D); Larry Rhoden (R, incumbent)Safe R
TennesseeJerri Green (D); Marsha Blackburn (R)Likely R
TexasGina Hinojosa (D); Greg Abbott (R, incumbent)Lean R
UtahNo governor election this NovemberNo race
VermontAmanda Janoo (D); Phil Scott (R, incumbent)Likely R
VirginiaNo governor election this NovemberNo race
WashingtonNo governor election this NovemberNo race
West VirginiaNo governor election this NovemberNo race
WisconsinDavid Crowley (D); Tom Tiffany (R)Lean D
WyomingKen Casner (D); Eric Barlow (R)Safe R

Click a state with a governor election to see its latest Decision Desk HQ forecast and available polling. D = Democratic; R = Republican; I = independent. Minnesota’s Democratic-Farmer-Labor Party is shown as D. California uses a top-two primary and Alaska has four finalists and ranked-choice voting. Other candidates may appear on individual state ballots. Consult your state or local election office for the complete ballot.

Two points need extra care. Alaska’s four-candidate ranked-choice contest cannot be reduced to one ordinary two-candidate first-round poll. In Rhode Island, independent Ken Block is also in the race: the Emerson/WPRI survey above found him ahead of the Republican nominee even though DDHQ classified the contest as safe Democratic. A rating describes a model’s overall assessment, not a substitute for the complete ballot or every candidate’s polling.

Why election night may not finish on election night

Closing times, mail-ballot rules and counting procedures vary by state. A delay by itself is not evidence of a problem: election officials must process and verify ballots before final certification. Alaska’s election agency says its ranked-choice results will not be available until November 18, after eligible ballots are reviewed and counted. Alaska Division of Elections

In Georgia, if no candidate wins a majority, the top two advance to a December 1 runoff. Maine uses ranked-choice voting in federal general elections. A close Senate map could therefore take longer than Tuesday night to settle. Georgia.gov · AP’s Maine guide

Election timeline

  1. NPR/PBS News/Marist conducts the national survey shown above. Marist
  2. Noble conducts its Nevada governor survey, finding Ford and Lombardo tied at 47%. Noble Predictive Insights
  3. Decision Desk HQ’s forecast snapshots used in this guide are published. DDHQ
  4. General Election Day. Poll hours and deadlines are set locally; voters should verify their own jurisdiction’s rules.
  5. Alaska says ranked-choice results will become available after eligible ballots are reviewed. Alaska Division of Elections
  6. Georgia’s general-election runoff is scheduled for contests in which no candidate wins a majority. Georgia.gov

How to use this guide

A poll estimates the preferences of the people surveyed at a particular time. Sampling uncertainty is only one possible source of error. A polling average combines selected surveys and depends on the aggregator’s choices. A forecast estimates outcomes using a model; DDHQ says its approach incorporates polls and other inputs. Its probabilities do not mean a candidate will receive that share of the vote. DDHQ methodology

The dates matter: the 50-state candidate guide reflects the linked October 27 compilation; DDHQ’s governor ratings and congressional forecast are October 31 snapshots; individual surveys have their own field dates. A newer poll, candidate change, court order or model revision could change the picture after this report was checked.

Sources and visual credits

DDHQ House and Senate forecast · DDHQ governor ratings · ElectioMap candidate guide · NPR/PBS News/Marist · RealClearPolling · Noble Predictive Insights · Emerson College · Alaska Division of Elections · Georgia.gov.

Thumbnail: 2014 archive photograph of the U.S. Capitol by Architect of the Capitol, via Wikimedia Commons, public domain, cropped. The hero’s ballot-box background is a generated conceptual illustration, not a photograph of a polling place. Charts: Newstro, based on the dated sources credited with each figure.